
Best weather in the world
Most people move abroad for taxes, freedom or family. Then they end up somewhere with weather they can't stand. This climate map shows you, for any place on Earth, how many days a year the weather actually feels right.
Where do you get the most comfortable days?
The greener, the more days a year temperature, humidity, rain and wind all feel right. Hover over the map or search for a place.
Humidity, rain and wind are free to set here. Custom temperatures, months, climate types and air quality (fine particulates) are Club features. The °F/°C switch in the "Your ideal climate" box changes the whole page.
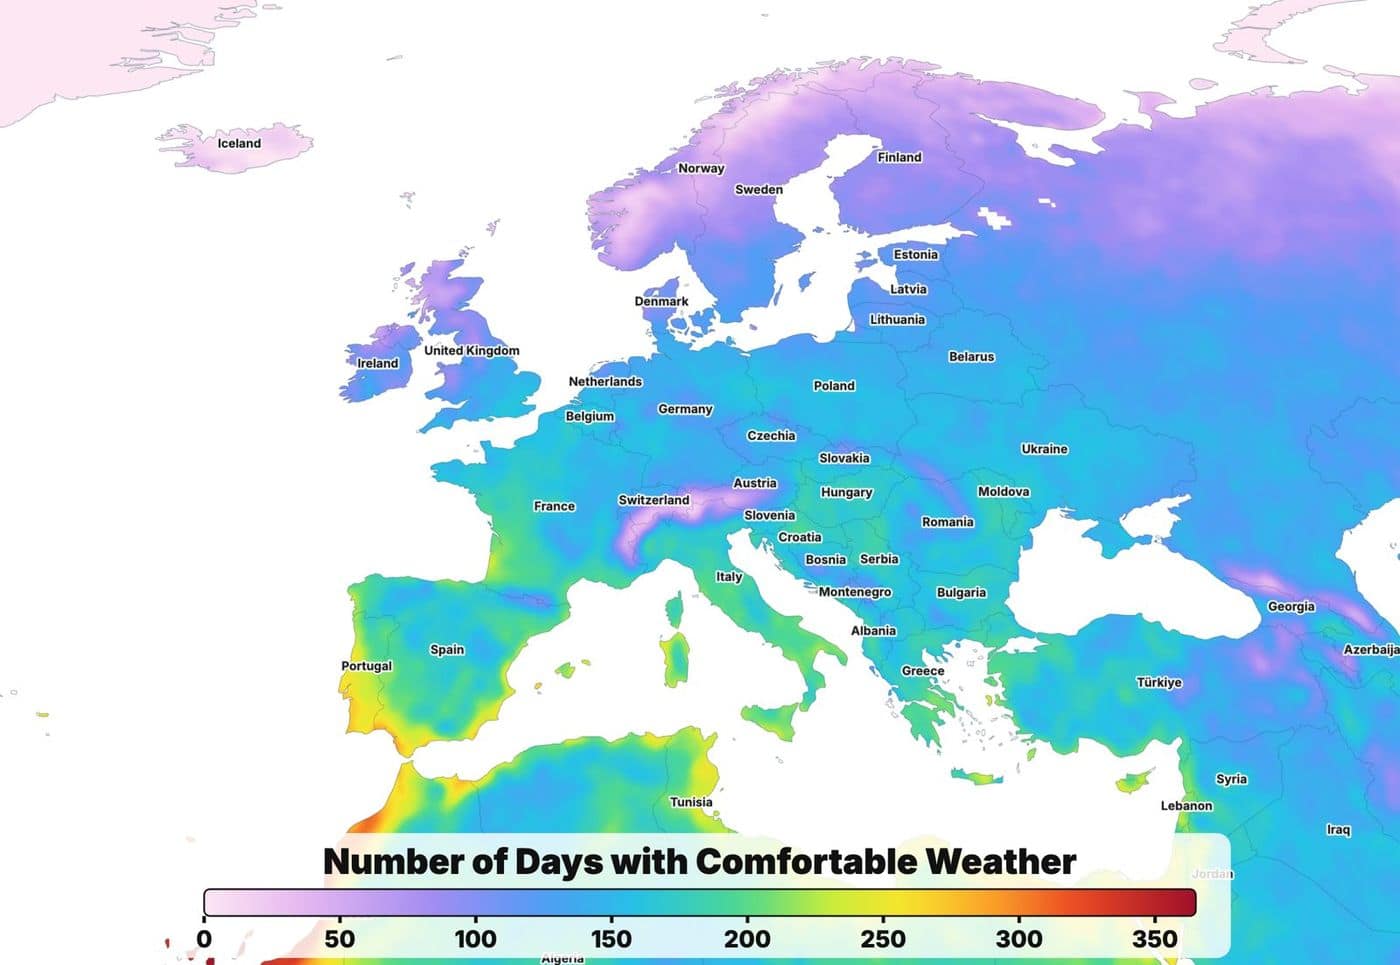
Count days, not averages.
A comfortable day is a day when the high, the low, humidity, rain and wind are all within your limits. On the same day.
A climate table can't tell you that. A monthly average of 75 °F says nothing about whether 20 days were muggy and 10 were rainy.
This map counts real days from 30 years of data. For every place on Earth. And for every place it shows you why the other days fall short: too hot, too muggy, too wet or too windy.
Where the weather fits most often.
For well-known places people move to, spread across every continent. For the first two lists: a comfortable day is a day when these 5 values fit at the same time. The sliders above don't change these lists.
Most comfortable days
Full yearEscape the northern winter
Nov to MarWarm all year
Warm daysAbout the third list: Denpasar (Bali), Indonesia and Panama City are warm all year, but mostly muggy. By the strict limits of the first list they end up with 0 comfortable days a year. The month filter for winter is a Club feature.
Six places on a lot of shortlists.
The same rule applies to all 6 places: a comfortable day is a day when these 5 values fit at the same time. Best months are the months with the most such days.

Las Palmas (Gran Canaria)
Spain
Best months: May and November to December
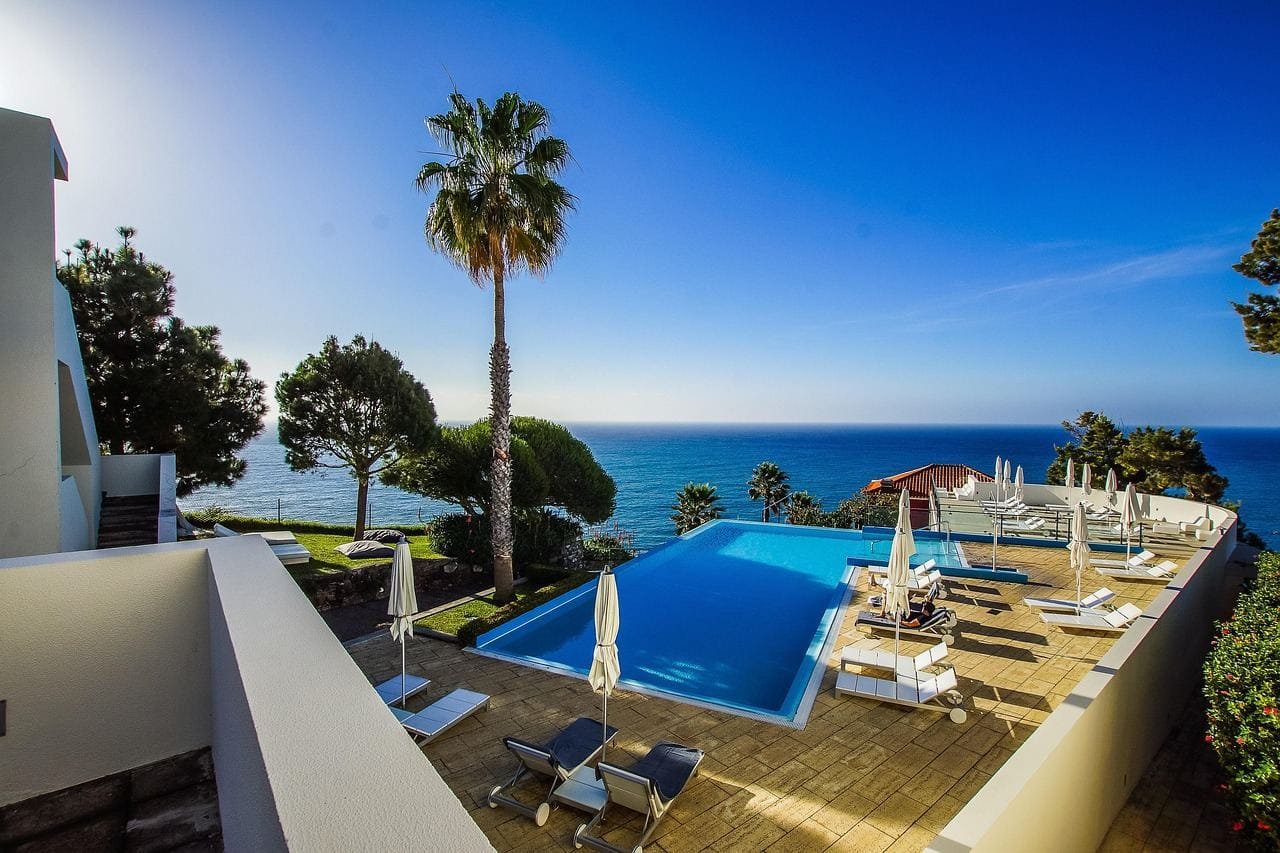
Funchal (Madeira)
Portugal
Best months: June and October

Lisbon
Portugal
Best months: June and October

Mexico City
Mexico
Best months: March and May to June

Cape Town
South Africa
Best months: March to April and December

Los Angeles
USA
Best months: April to July
Canary Islands, Madeira, Medellín: eternal spring.
Some places stay between spring and early summer all year. Usually thanks to a cool ocean current or their altitude. That's exactly what the map's Eternal Spring climate type is for.
Here is how far apart the coolest and the warmest month are, as the average daily high:
- Las Palmas (Gran Canaria): February 70 °F (21 °C), August 81 °F (27 °C)
- Santa Cruz (Tenerife): January 70 °F (21 °C), July 86 °F (30 °C)
- Funchal (Madeira): February 68 °F (20 °C), August 81 °F (27 °C)
- Medellín (Colombia): November 81 °F (27 °C), July 84 °F (29 °C)
- Cuenca (Ecuador): July 63 °F (17 °C), January 68 °F (20 °C)

Live in your ideal climate all year. In 3 places.
Every place has a bad season. Too hot, too wet, too cold. That's why perpetual travelers, digital nomads and many of our clients live by the GoodbyeMatrix Three-Base Strategy: the year is deliberately split across 3 locations.
It buys you more than good weather. Spread your life across 3 countries and you don't depend on a single state: not for residency, not for taxes, not in a crisis. What's possible in your case depends on each country's immigration and tax rules. That's what the consultation is for.
The three-base planner in the Club map works out the climate part for you:
- You pick regions, countries or cities you would consider. Or leave the whole world open.
- The planner splits your year across 2 to 4 bases, month by month, so you spend as many days as possible in your ideal climate.
- Every base with a residency program: on request, only countries you can legally move to, linked straight to our program pages.
- Tips for more days: the planner tells you which limit to loosen by a few degrees to gain noticeably more comfortable days.

The map that shows your climate.
The free map uses a fixed standard climate. As a Club Member, you set everything yourself and see things about every place that nobody else shows you.

- Your own ideal climate
- Month filter and 5 climate types
- Hazards and safety
- Infrastructure index by country
- Residency and taxes
- Three-base planner
Your own ideal climate
Daytime and nighttime temperature, humidity, rain and wind: you set the limits. The map recolors instantly.
Month filter and 5 climate types
Only November through March? Only summer? One click. Plus Eternal Spring, Mediterranean, Warm and Dry, Tropical Without Humidity, Mild and Fresh.
Hazards and safety
Earthquakes, tsunamis, volcanoes, storms and floods around every place, plus the country's homicide rate. Before you commit.
Infrastructure index by country
Energy, food, water, health care, internet, natural hazards and stability as a score from 0 to 100, with rank and regional values.
Residency and taxes
Tax system, residency programs and citizenship by country, linked straight to our program pages.
Three-base planner
Pick regions, countries or cities. The planner splits your year across up to 3 places so you live in your ideal climate all year.
Everything the map can do. Plus the whole Club.
The GoodbyeMatrix Club is more than the map: monthly analysis on moving abroad, taxes, asset protection and investments, live presentations, courses and access to the Sovereigns app.
The climate map with every feature is included for members.

How we calculate.
- Data source: ERA5 from the European Copernicus program (ECMWF), climate 1991 to 2020, 0.25 degree grid (about 15 miles).
- Days, not averages: For every grid cell, 84 real days from those 30 years, spread across all months.
- Checked against measurements: Temperatures and rainy days are calibrated against more than 5,000 World Meteorological Organization weather stations. After that, the average temperature error is about 2.3 °F (1.3 °C).
- Local correction: If a town sits higher or lower than its grid cell, we adjust the temperature for elevation. Where a weather station is nearby, we use its measurements.
- Humidity: measured by dew point, not relative humidity.
- Limits: A grid cell averages valleys, slopes and coast. The map shows past climate, not a forecast.
Contains modified Copernicus Climate Change Service information. Weather stations: WMO climate normals 1991 to 2020 and NOAA NCEI. Base map: Natural Earth. Preliminary data: the numbers will get more precise with the complete dataset.
Move abroad with
Sergio von Facchin.
Climate is where it starts. A real plan also covers residency, taxes, health insurance and asset protection.
Sergio has worked since 2016 as an expert in moving abroad, living legally tax-free, asset protection and second citizenship. He is the founder of GoodbyeMatrix and has helped well over a thousand clients put their international setup in place.
What people ask most.
What counts as a comfortable day?
A day when all 5 values fit at the same time:
Afternoon high: 20 to 30 °C68 to 86 °F
Night low: 10 to 20 °C50 to 68 °F
Humidity: dew point up to 16 °C61 °F
Rain: up to 5 mm0.2 in per day
Wind: gusts under 50 km/h31 mph
The map counts those days across 30 years and scales them to one year.
What country has the best climate in the world?
It depends on what good weather means to you. With the map's standard climate, the leaders among popular destinations are Las Palmas (Gran Canaria), Spain, Mexico City and Funchal (Madeira), Portugal. Club Members set their own limits, and the ranking changes instantly.
Where is it 70 degrees year round?
Among well-known destinations, the monthly high stays above 70 °F (21 °C) all year in Medellín, Colombia, San José, Costa Rica, Mexico City and Las Palmas (Gran Canaria), Spain. Watch out for Denpasar (Bali), Indonesia and Panama City: it's often muggy there.
Where should I live if I hate winter?
From November through March, the leaders are Las Palmas (Gran Canaria), Spain, Santa Cruz de Tenerife, Spain, Cape Town, South Africa and Funchal (Madeira), Portugal. How affordable a place is then comes down to rent, visas and taxes. That's what a consultation is for.
Is Madeira warmer than the Canary Islands?
No, the Canary Islands are slightly warmer. In February, the average high in Las Palmas is 70 °F (21 °C), in Funchal 68 °F (20 °C). Las Palmas gets 208 comfortable days a year, Funchal 183.
Where in Europe is it not too hot in summer?
Along the Atlantic coast. With highs of 79 °F (26 °C) at most from May through September, the leaders are Southend-on-Sea, United Kingdom, Portsmouth, United Kingdom, Setúbal, Portugal and Le Havre, France.
What climate is healthiest for humans?
There is no official ranking. Many people feel best between 64 and 79 °F (18 and 26 °C) with low humidity. That is exactly the Eternal Spring climate type: the Canary Islands, Madeira, Medellín or Cuenca.
What does muggy mean, and what dew point feels uncomfortable?
Muggy means the air is so humid that sweat barely evaporates. Dew point shows this better than relative humidity. Up to 61 °F (16 °C) feels pleasant, from about 64 °F (18 °C) sticky, from 70 °F (21 °C) oppressive.
Can I set my own ideal climate?
Yes, as a Club Member. You set temperature, humidity, rain, wind, air quality and months yourself and see hazards, infrastructure and residency programs for every place. The free map uses a fixed, pleasant standard climate.
Can I switch between °F and °C?
Yes, in the top right corner of the "Your ideal climate" box. The map switches instantly, including wind and rain, with no reload. Your choice is saved.
Is there a tool that shows where to live based on climate?
Yes, this map. It counts the days per year when the weather fits, for any place on Earth. Club Members can set their own limits for temperature, humidity, rain, wind and months.
How accurate is this map?
Accurate enough to compare places and regions. After calibration against more than 5,000 weather stations, the average temperature error is about 2.3 °F (1.3 °C). A grid cell is about 15 miles wide, so valleys and slopes can differ.
Found your ideal climate? Let's plan your move.
Perfect weather doesn't help much if you can't live there. Or if you end up paying more tax than you do today. In a consultation, we work out which countries fit your life.
Book a Consultation